

EOS Labs partners with Pomelo Grants to promote development of the ecosystem.

🌐 中文
Pomelo Grants Season 7 focused on simplifying the approval criteria and areas of focus with two matching pools: EOS Native and EOS EVM.
This season, we saw a total of 107 approved grants. The EOS Native pool with 69 approved grants and EOS EVM with 38.
Our analysis identified some patterns of Sybil attack and self-donations from owners and team members. Adjustments resulted in a total of $29,117 being returned to the matching pool to be redistributed, an increase of $12,411 compared to Season 6.
There were no disqualifications this season.
EOS Labs to provide matching funds
On November 14, EOS Labs announced that it would provide the Season 7 matching funds as part of its mission to build a more prosperous ecosystem. EOS Labs said it planned to distribute the funds based on its audit of each project’s delivery history and value to the ecosystem.
Since then, EOS Labs has decided to pay out the full matching funds of $150,000 according to the established rules of Pomelo Grants and the Pomelo team’s analysis.
This report’s results are final and claiming will open as usual after the appeal period ends.
Pomelo analysis results
Grants with reduced matching allocations
Depending on the level of evidence, donations with Sybil patterns are collapsed or removed, so they don’t count toward the matching allocation. Similarly, donations made by grant owners and team members to their own grants are not matched.
Sybil patterns and self-donations resulted in adjustments so that:
8 grants had their matching pool distribution reduced by between 87% and 100%.6 grants had their matching pool distribution reduced by between 33% and 56%.5 grants had their matching pool distribution reduced by between 20% and 29%.General adjustments to matching allocations
When we remove the donations that are violating the rules, it broadly affects the matching allocations of many grants. This is because fraudulent donations are often made to a variety of grants to make them seem legitimate.
Some additional grants had their matching allocations reduced, and this does not necessarily mean the grants are malicious. Some grants had an increase in their matching allocations due to the removal or collapse of donations, which allowed some of the matching pool to be redistributed.
To see all the changes that occurred due to the adjustments and how this affects your grant, view the Pomelo Season 7 — Public Summary.
Appeals
Grant owners can appeal the results of Pomelo’s analysis by sending a description of the action taken and any evidence you have that supports your appeal to support@pomelo.io by December 19, 2023.
Top 5 grants by matching allocation per pool
EOS Native
Totoro — Decentralized Open Source Defi Product
Number of contributors: 37Total raised, USD: $873Matching allocation, USD: $6,314Number of contributors: 38Total raised, USD: $1,024Matching allocation, USD: $5,978Number of contributors: 59Total raised, USD: $790Matching allocation, USD: $5,853DAOBOX, an open source governance tool
Number of contributors: 36Total raised, USD: $1,001Matching allocation, USD: $5,819EOS Chinese Community on Weibo
Number of contributors: 62Total raised, USD: $493Matching allocation, USD: $5,327EOS EVM
Number of contributors: 54Total raised, USD: $990Matching allocation, USD: $9,668Noah Swap, an innovation of DeFi on EOS EVM
Number of contributors: 42Total raised, USD: $1,505Matching allocation, USD: $9,653Number of contributors: 40Total raised, USD: $1,230Matching allocation, USD: $9,026Number of contributors: 65Total raised, USD: $612Matching allocation, USD: $7,486EOS Support — The EOS Network’s Concierge
Number of contributors: 63Total raised, USD: $982Matching allocation, USD: $5,481Why do we audit the results?
Pomelo uses the quadratic funding formula to allocate the matching pools to eligible grants. This method requires accurate tracking of how many donors contribute to each project, including how many of those donor accounts are real unique humans and not multiple fake accounts created to game the system.
So after donations close, the Pomelo team audits the season results to identify any intent to exploit the system. This investigation includes following up on reports from community members.
The team focuses on ensuring grants follow the Pomelo Terms and Conditions, and where there is evidence of violations, makes adjustments. During a Pomelo season, rule violations primarily fall under offers and exchanges (quid pro quo), Sybil attacks, and collusion.
But that’s not all we look for. For more explanation of the rules with examples, see Pomelo Rules.
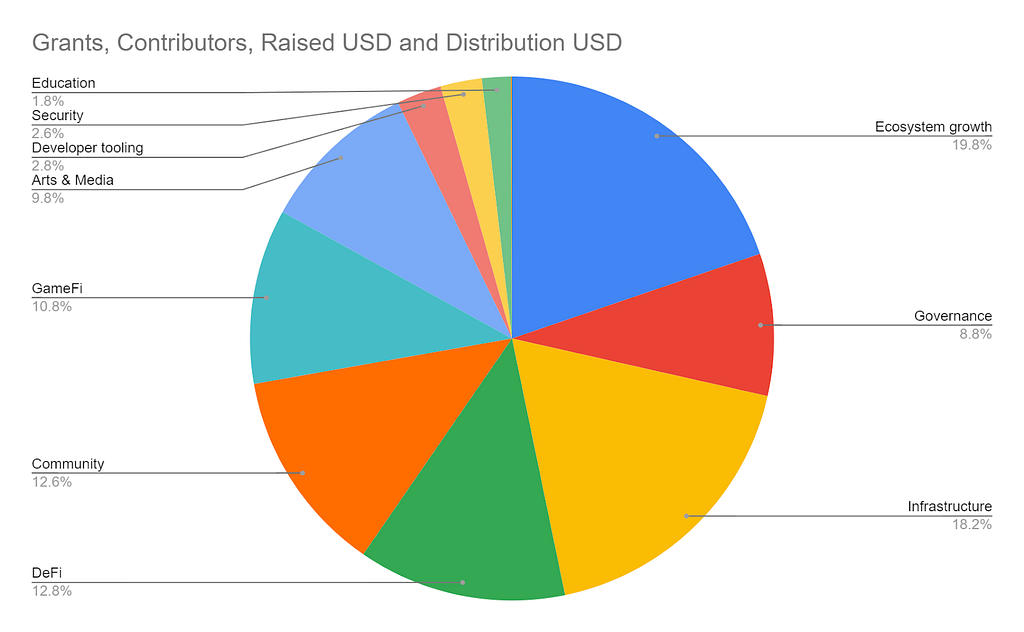
Activity by category and region
Category
There were no big surprises in which categories had the most activity this season. The only notable change was Community increasing its share from 4% to 12.6%.
Ecosystem Growth (19.8%) and Infrastructure (18.2%) kept their top spots, with DeFi gaining some ground at 12.8%. GameFi didn’t have a dedicated pool this season but got 10.8%, and Governance saw an increase from 5.2% to 8.8%.
Figure 1. Grants, contributors, amount raised (USD), and distribution (USD) by category
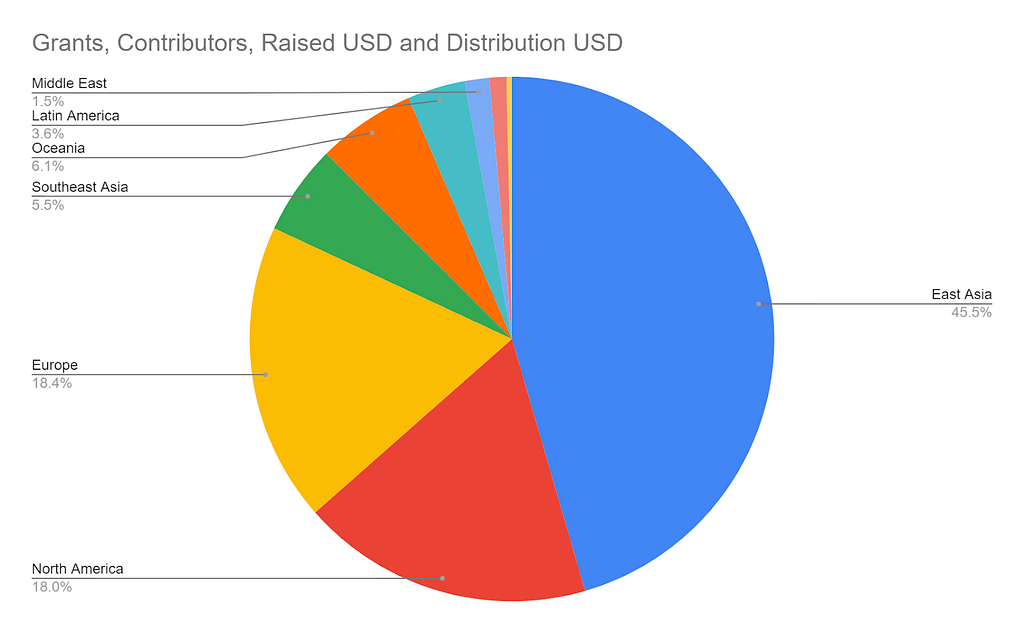
Region
Activity by region saw some big changes.
East Asia increased its share to 45.5%, with North America decreasing to 18%. Europe held steady at 18.4%, but South Asia (5.5%), Latin America (3.6%), and the Middle East (1.5%) all decreased.
Oceania made an appearance on the chart for the first time since Season 1 and claimed 6.1%.
Figure 2. Grants, contributors, amount raised (USD), and distribution (USD) by region
Season 7 analysis data
Pomelo Season 7 — Public SummaryDonation GraphCompare to the Season 6 report:
Pomelo Season 6 Analysis Report